


Introduction
Contents
- Introduction
- Editor’s Choice
- What is an Electric Kettle?
- General Electric Kettle Statistics
- By Revenue
- By Country Revenue
- By Region
- By Average Revenue Per Household
- By Brand Share
- Electric Kettle Statistics Sales Channel
- By Volume
- Types of Electric Kettle
- Manufacturers of Electric Kettle
- By Usage Share
- Recent Developments
- Top Electric Kettles
- Conclusion
Electric Kettle Statistics: Based on the report analysis, the global market revenue generated by the Electric Kettle industry is projected to reach USD 5.51 billion by the end of 2028. The market for electric kettles has been expanding significantly worldwide due to technological advancements. Factors propelling the overall market growth include the expansion of the kitchen appliances industry, the increasing popularity of electric kettles, and growing global consumer preferences for energy-saving technologies.
This Electric Kettle Statistics report will encompass all essential aspects of the industry, including revenue shares, key players, market uses, types, applications, and geographical distribution.
Editor’s Choice
- The global market value for electric kettles in 2023 is expected to be around USD 4.29 billion.
- By 2031, the market size is projected to grow to USD 27.09 billion, with an annual growth rate of 4.5% from 2023 to 2031.
- Between 2023 and 2028, the market is expected to grow at a rate of 5.13% annually.
- China is estimated to generate the highest revenue in 2023, approximately USD 1,119 million.
- The average revenue per household for electric kettles in 2023 is expected to be about USD 1.95.
- The volume of electric kettles is projected to reach 149.4 million units by 2028.
- In 2024, the market volume is expected to grow by 2.4%.
- The average number of electric kettles per household in 2023 is projected to be 0.06 units.
- Sales channels for electric kettles in 2023 are divided into 71.1% offline and 28.9% online.
- In China, electric kettles have become an essential household item, heavily influenced by the country’s tea-drinking culture and the availability of advanced and stylish designs.
You May Also Like To Read
- Cameras Statistics
- Fitness Trackers Statistics
- Tablets Statistics
- Drones Statistics
- Foldable Smartphones Statistics
- Sleep Tracker Statistics
- Tablet Statistics
- Smart Home Statistics
- Dashboard Camera Statistics
What is an Electric Kettle?
An Electric Kettle is an electronic device that is used for boiling water for preparing tea, coffee, soups, and various beverages. This device is mostly used as a kitchen appliance available with innovative features such as an adjustable backlight, remote control ability, power consumption monitors, schedules heating features, etc.
General Electric Kettle Statistics
(Source: mordorintelligence.com)
- Market Value Projections (2029): Global News Wire predicts the market to reach $18,020 million by 2029, expanding at a CAGR of 3.85% from 2023 to 2029.
- Product Features: Electric kettles typically offer features like variable water temperature settings, the option of being cord or cordless, an average power usage of 1500 watts, and a standard capacity to hold 6-8 cups of water.
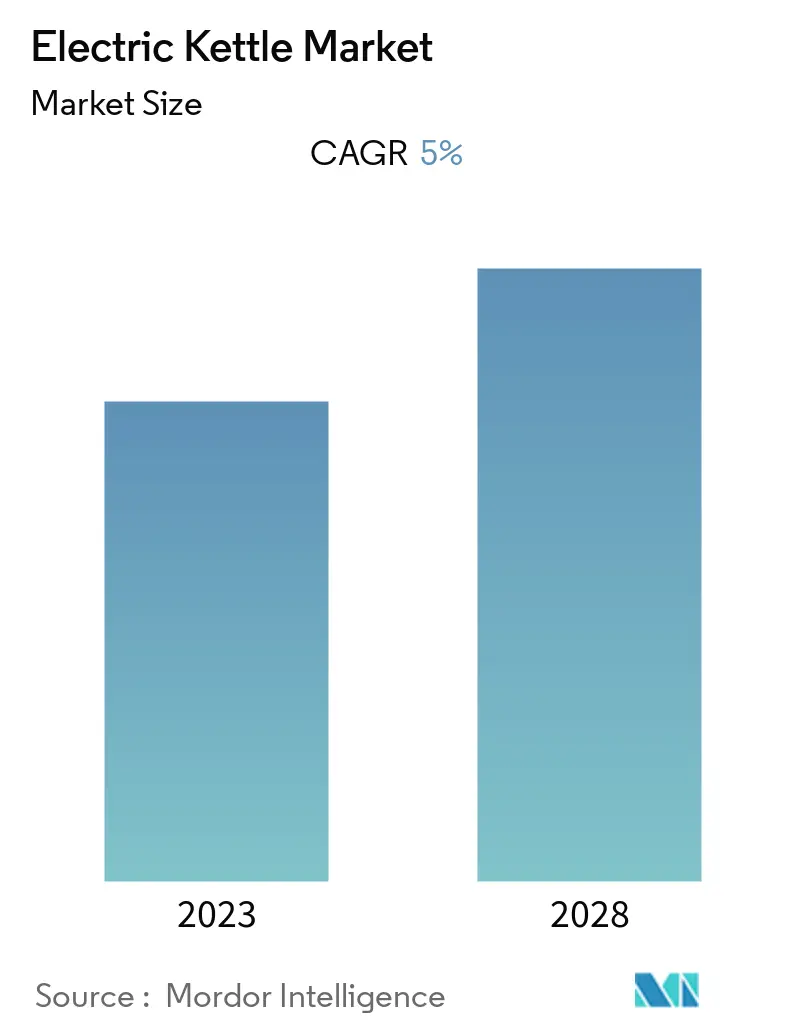
- Growth Rate (2023-2028): As per Mordor Intelligence, the market is expected to grow at a CAGR of 5% during this period.
- Regional Market Dynamics: The Asia Pacific region is the fastest-growing market, while Europe holds the largest market share in 2023.
- Market Size Forecast (2030): Kbv’s research analysis suggests that the market size will increase by $5.8 billion by 2030, with a CAGR of 4.3%.
- Popular Materials: In 2023, stainless steel is the most widely used material in electric kettles, followed by plastic, glass, and others.
- Segmentation by Application: The residential segment leads the market, projected to reach a value of $4.9 billion by 2030. The commercial segment is anticipated to grow at a CAGR of 6.1% from 2021 to 2028.
- Dominant Region (2030): The Asia Pacific region is expected to dominate the market with a projected value of $2.6 billion by 2030.
By Revenue

(Reference: statista.com)
- As Statista reports, revenue generated by the Electric Kettle industry around the world in 2023 has reached $4.29 billion.
- Furthermore, in coming years, the electric kettle market is expected to gain higher revenues followed by 2024 ($4.51 billion), 2025 ($4.75 billion), 2026 ($5 billion), 2027 ($5.25 billion), and 2028 ($5.51 billion).
By Country Revenue
(Source: statista.com)
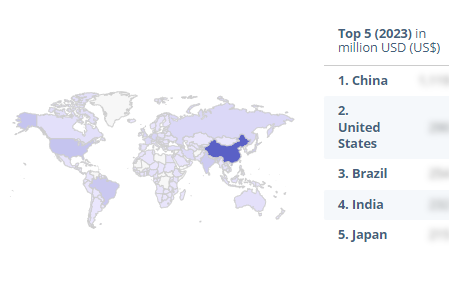
- China’s Market Dominance: With an expected revenue of $1,119 million, China leads due to its massive consumer base, strong manufacturing sector, and the cultural prevalence of tea drinking, which boosts demand for electric kettles.
- High Revenue in Developed Countries: The United States ($290 million), Japan ($215 million), and Germany ($147 million) show substantial market values, likely due to higher disposable incomes, advanced retail infrastructure, and a preference for convenient and efficient kitchen appliances.
- Emerging Markets’ Contribution: Countries like Brazil ($254 million), India ($232 million), and Russia ($122 million) reflect growing markets. This growth can be attributed to increasing urbanization, rising middle-class populations, and greater adoption of modern kitchen appliances.
- Diverse Revenue in Other Regions:
- European Countries: Nations like the United Kingdom ($134 million), France ($108 million), and Italy ($56 million) show notable market sizes, influenced by established economies and a preference for quality kitchen appliances.
- African and Middle Eastern Markets: Countries such as Egypt ($33 million), South Africa ($14 million), and Saudi Arabia ($18 million) have smaller, yet growing markets, possibly due to increasing urbanization and changing lifestyles.
- Asian Markets: Regions like Indonesia ($50 million), Malaysia ($17 million), and Thailand ($49 million) demonstrate growing market sizes, driven by expanding economies and evolving consumer preferences.
- Market Dynamics in North America and South America: Canada ($58 million) and Mexico ($22 million) show healthy market sizes in North America, while in South America, Argentina ($9 million) and Chile ($14 million) indicate smaller but potential markets.
You May Also Like To Read
- Smart Video Doorbell Statistics
- Wireless Gaming Mouse Statistics
- Electric Kettle Statistics
- Leaf Blower Statistics
- Zero Turn Mower Statistics
- Android TV Box Statistics
- Video Doorbells
- 360 Camera Statistics
- Portable Power Bank Statistics
- Bose Corporation Statistics
- Smartphone Sales Statistics
- Portable Printer Statistics
By Region
- According to Research and Market report analysis, the electric kettle market share in the Asia Pacific region is expected to reach a CAGR of 4.6% from 2023 to 2030.
- Whereas, the market growth in the North American region is expected to grow 4.45% from 2023-28.
- Lastly, the European electric kettle market growth is predicted to be 3.6% from 2023 to 2030.
- By the end of 2028 the expected market growth in the region of South Africa by 6.81% from 2023 to 2028.
By Average Revenue Per Household

(Reference: statista.com)
- According to Statista Market Insights, in terms of total number of per household revenue is expected to be $1.95 by the year 2023
- Furthermore, average revenue per household is followed by 2024 ($2.02), 2025 ($2.09), 2026 ($2.17), 2027 ($2.25), and 2028 ($2.33).

(Reference: statista.com)
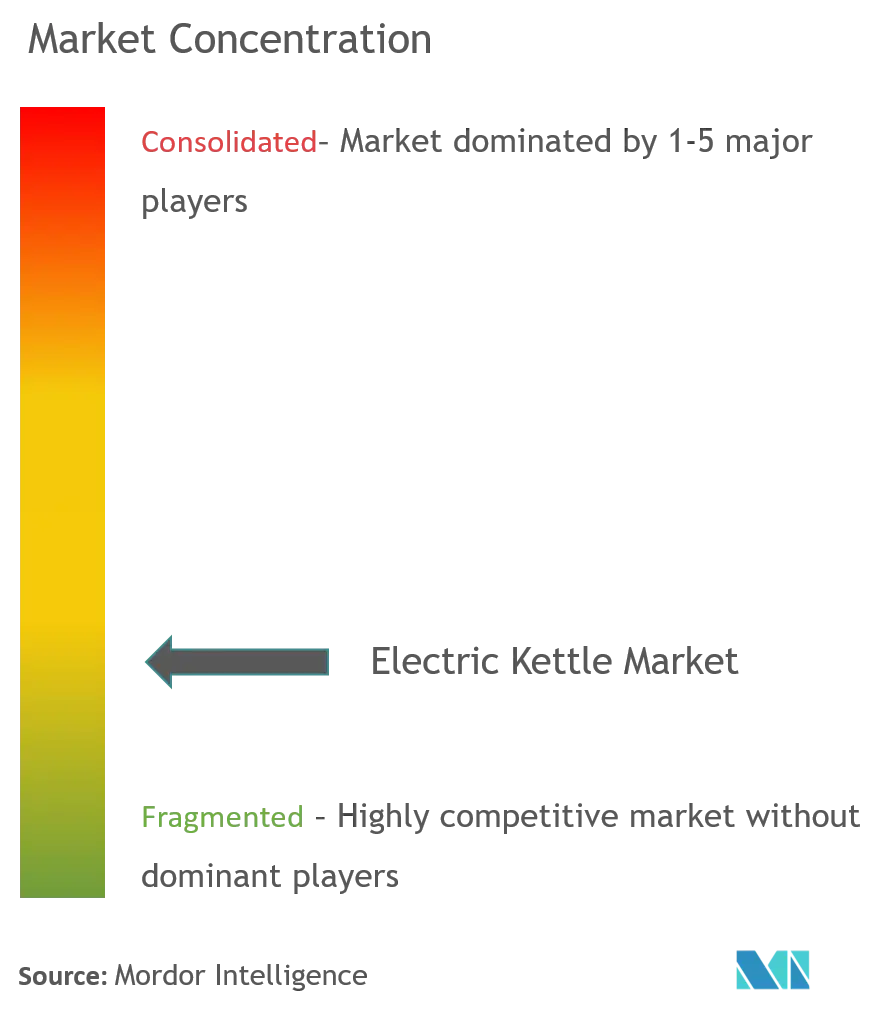
In 2022, the brand share in the electric kettle industry was led by two prominent brands, Braun and Sunbeam, each holding a 7% share. This dominance can be attributed to their strong brand recognition, consistent quality, and wide range of products appealing to diverse consumer preferences. Other notable brands in the market include:
- Cuisinart and MILTON: Both brands captured 5% of the market share. Their popularity can be linked to their reputation for quality products and innovative features that cater to the needs of modern kitchens.
- Smaller Market Shares: Brands like Gourmia, Hamilton Beach, IRIS OHYAMA, MONDIAL, MORPHY RICHARDS, and T-fal each held a 2% share. These brands maintain their market presence through specific niches, competitive pricing, or unique product offerings.
- Other Brands: Collectively accounted for 6.4% of the market. This segment likely includes a variety of smaller or regional brands, each catering to specific customer needs or preferences, indicating a diverse and competitive market landscape.
Electric Kettle Statistics Sales Channel

(Reference: statista.com)
- Dominance of Offline Sales in 2023: Offline channels led with a 71.1% revenue share, indicating a strong consumer preference for purchasing electric kettles through traditional retail stores. This preference could be due to the tactile experience of seeing and handling the product before purchase.
- Growing Trend Towards Online Sales: Online sales, while constituting 28.9% in 2023, are expected to see a consistent rise in the coming years – reaching 32.6% in 2024, 36.9% in 2025, 37.2% in 2026, and 38% by 2027. This growth trend reflects the increasing consumer comfort with e-commerce, driven by convenience, wider selection, competitive pricing, and enhanced digital shopping experiences.
- Decline in Offline Sales’ Share: Correspondingly, the share of offline sales is projected to decrease – to 67.4% in 2024, 63.1% in 2025, 62.8% in 2026, and 62% by 2027. Despite the decline, offline channels remain significant, likely due to the established retail infrastructure and the preference of certain consumer segments.
- Mobile vs. Desktop Online Sales: The split between mobile and desktop online sales also shows a trend. In 2023, 56.9% of online sales were through mobile, and 43.1% via desktop. This split is expected to shift further towards mobile, reaching 58.3% in 2024, 59.5% in 2025, 60.4% in 2026, and 61.1% in 2027. The increasing preference for mobile shopping is influenced by the ubiquity of smartphones and the convenience of shopping anytime and anywhere.
By Volume

(Reference: statista.com)
The market volume and growth projections for the Electric Kettle industry from 2023 to 2028 are as follows:
- Market Volume in 2023: Expected to reach 133.4 million units, with a growth rate of 2.5%. This indicates a steady demand for electric kettles, likely driven by their convenience and increasing consumer preference for quick and efficient kitchen appliances.
- Stable Growth in Subsequent Years:
- 2024: Volume remains at 133.4 million units, but the growth rate slightly decreases to 2.4%. This could be due to market saturation in certain regions.
- 2025: A rise to 139.7 million units with a 2.3% growth rate, suggesting a continued, albeit slightly slower, market expansion.
- 2026 and 2027: Consistent growth with volumes reaching 142.9 million and 146 million units, respectively, both years seeing a 2.3% growth rate. This steady growth might be attributed to ongoing innovations and the entry of new consumers in the market.
- 2028: Projected to reach 149.4 million units, with a growth rate slowing to 2.2%. This gradual decline in growth rate could indicate maturing markets and the stabilization of consumer demand.
Types of Electric Kettle
- There are 5 different types of electric kettle available within the marketplace traditional electric kettle, cordless electric kettle, glass electric kettle, stainless steel electric kettle, and variable temperature electric kettle.
- The traditional electric kettle comes with a heating element in the bottom of the kettle along with an automatic power-off feature once water is boiled.
- The cordless electric kettle has a base that is connected to the kettle, used for generating power sources, and can be easily removed from the base which is more convenient to use.
- Glass electric kettle has a glass body so that users can easily see the inside boiling process. The heating element of the kettle is present at the bottom which supplies power along with an automatic power turn-off feature.
- The stainless steel electric kettle has a rust-resistant body and is easy to clean the heating element is located at the bottom of the kettle and automatic shut-off feature.
- Variable temperature electric kettle is a popular growing type around the world as they allow users to set the temperature according to preference and the heating element is the same as other types.
Manufacturers of Electric Kettle
(Source: mordorintelligence.com)

(Reference: mdpi.com)
- According to the reports of MDPI, across the global market of electric kettles, 17.8 million units/year are expected to be sold in the European Union by the end of 2030.
- As of 2023, only 6 of the European population used electric kettles for boiling water.
- Other uses are followed by very often (10%), quite often (15%), occasionally (33%), never (35%), unaware about the device usage (1%).
Recent Developments
New Product Launches
- Smart Kettles: Manufacturers are increasingly focusing on launching smart electric kettles equipped with advanced features like Wi-Fi or Bluetooth connectivity, allowing users to control the kettle through their smartphones. These products cater to the growing demand for smart home devices and offer functionalities such as temperature control, keep-warm options, and rapid boiling technology, which reduces energy consumption and boiling time.
Acquisitions and Mergers
- Spectrum Brands Holdings, Inc. completed the acquisition of Tristar Products, a company known for its innovative kitchen appliances, including electric kettles. This move is expected to enhance Spectrum Brands’ portfolio in the small kitchen appliances market, including electric kettles.
- Groupe SEB, a global leader in small domestic equipment, has continued its expansion strategy by acquiring several smaller appliance companies, further strengthening its position in the electric kettle market.
Technological Advancements
- Rapid Boiling Technology: This innovation has become a key focus for companies like Breville and Philips, which are integrating powerful heating elements into their electric kettles to significantly reduce boiling time and improve energy efficiency.
Sustainability Initiatives
- Companies like Bosch and Midea Group are emphasizing the development of energy-efficient electric kettles that align with global sustainability goals. These kettles are designed to consume less electricity, appealing to environmentally conscious consumers.
Top Electric Kettles
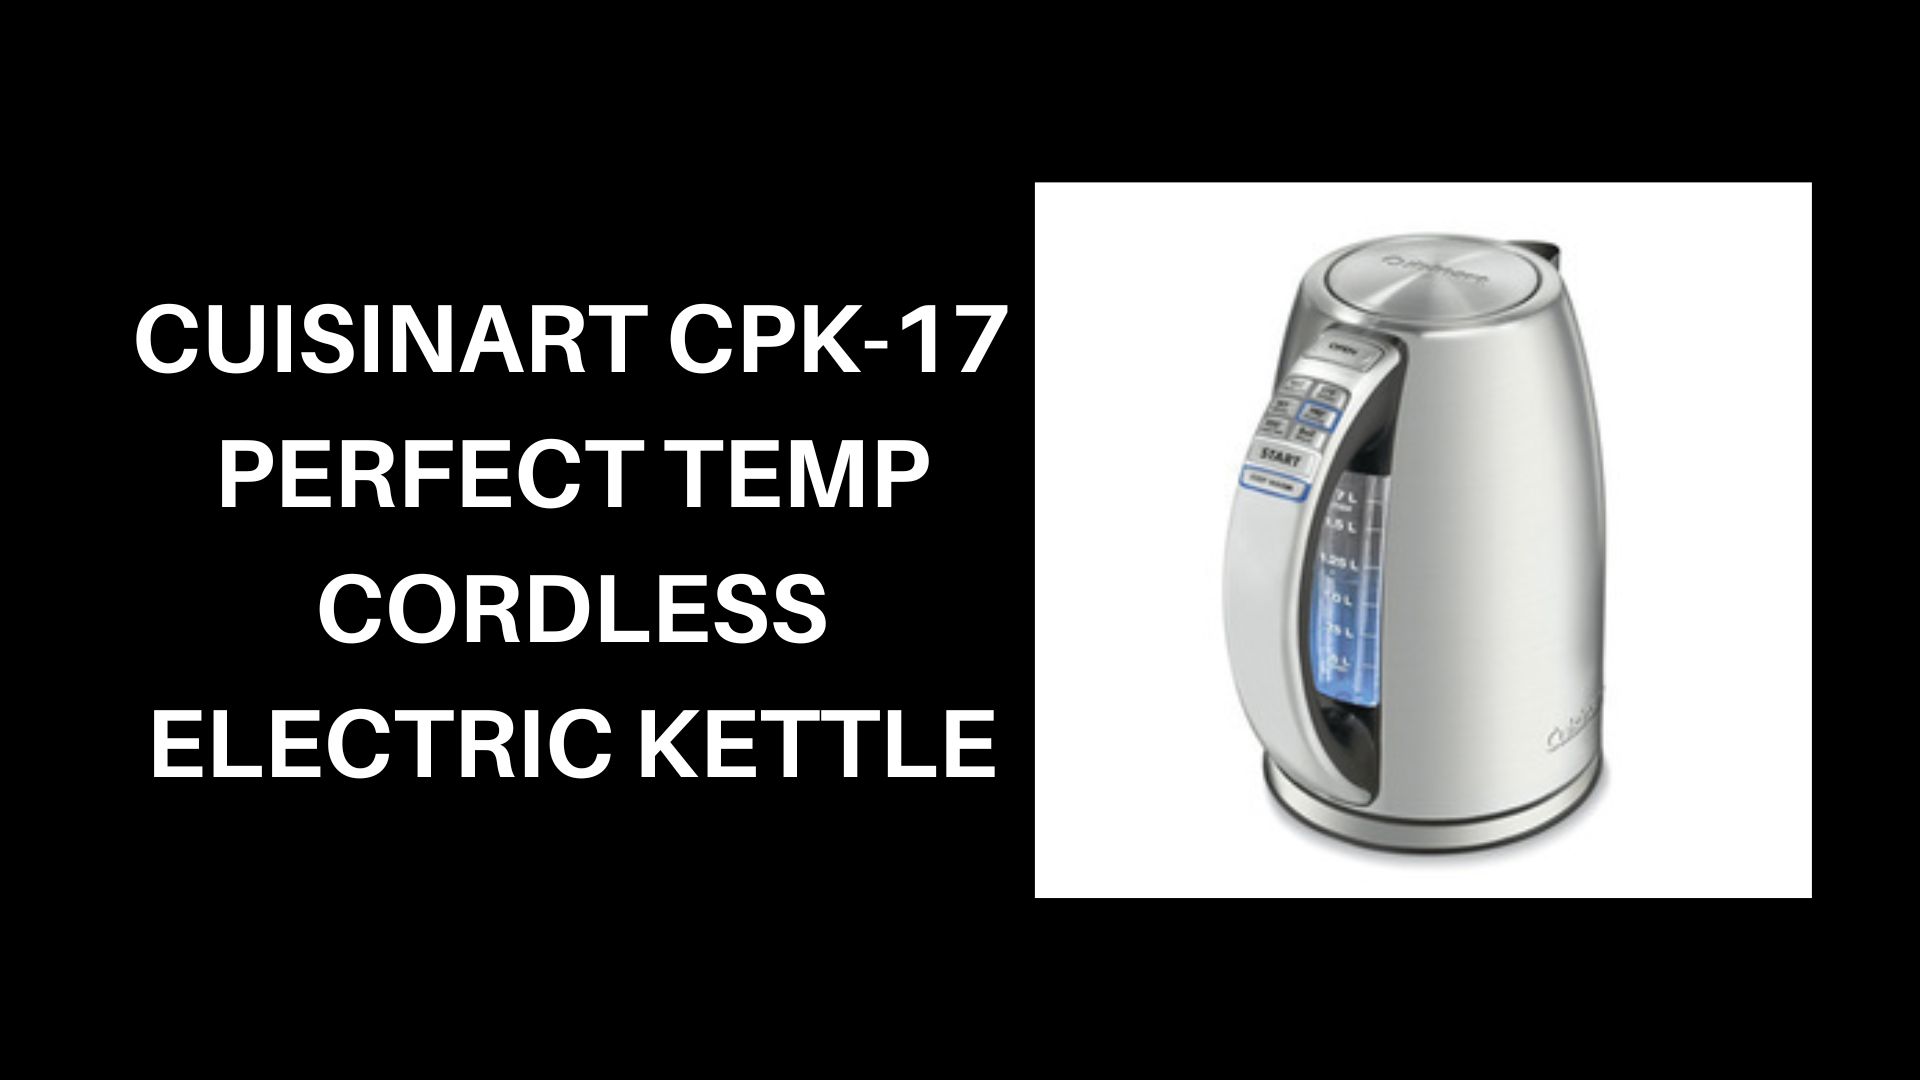
#1. Cuisinart CPK-17 Perfect Temp Cordless Electric Kettle (best for all purposes)
(Source: nytimes.com)
- The cost of this electric kettle is $70 at Wayfair and $70 at Amazon.
- The electric kettle has a water boiling capacity of 1.7 L within just 7 minutes.
- The kettle consists of 6 different temperature preferences and water remains warm for 30 minutes.
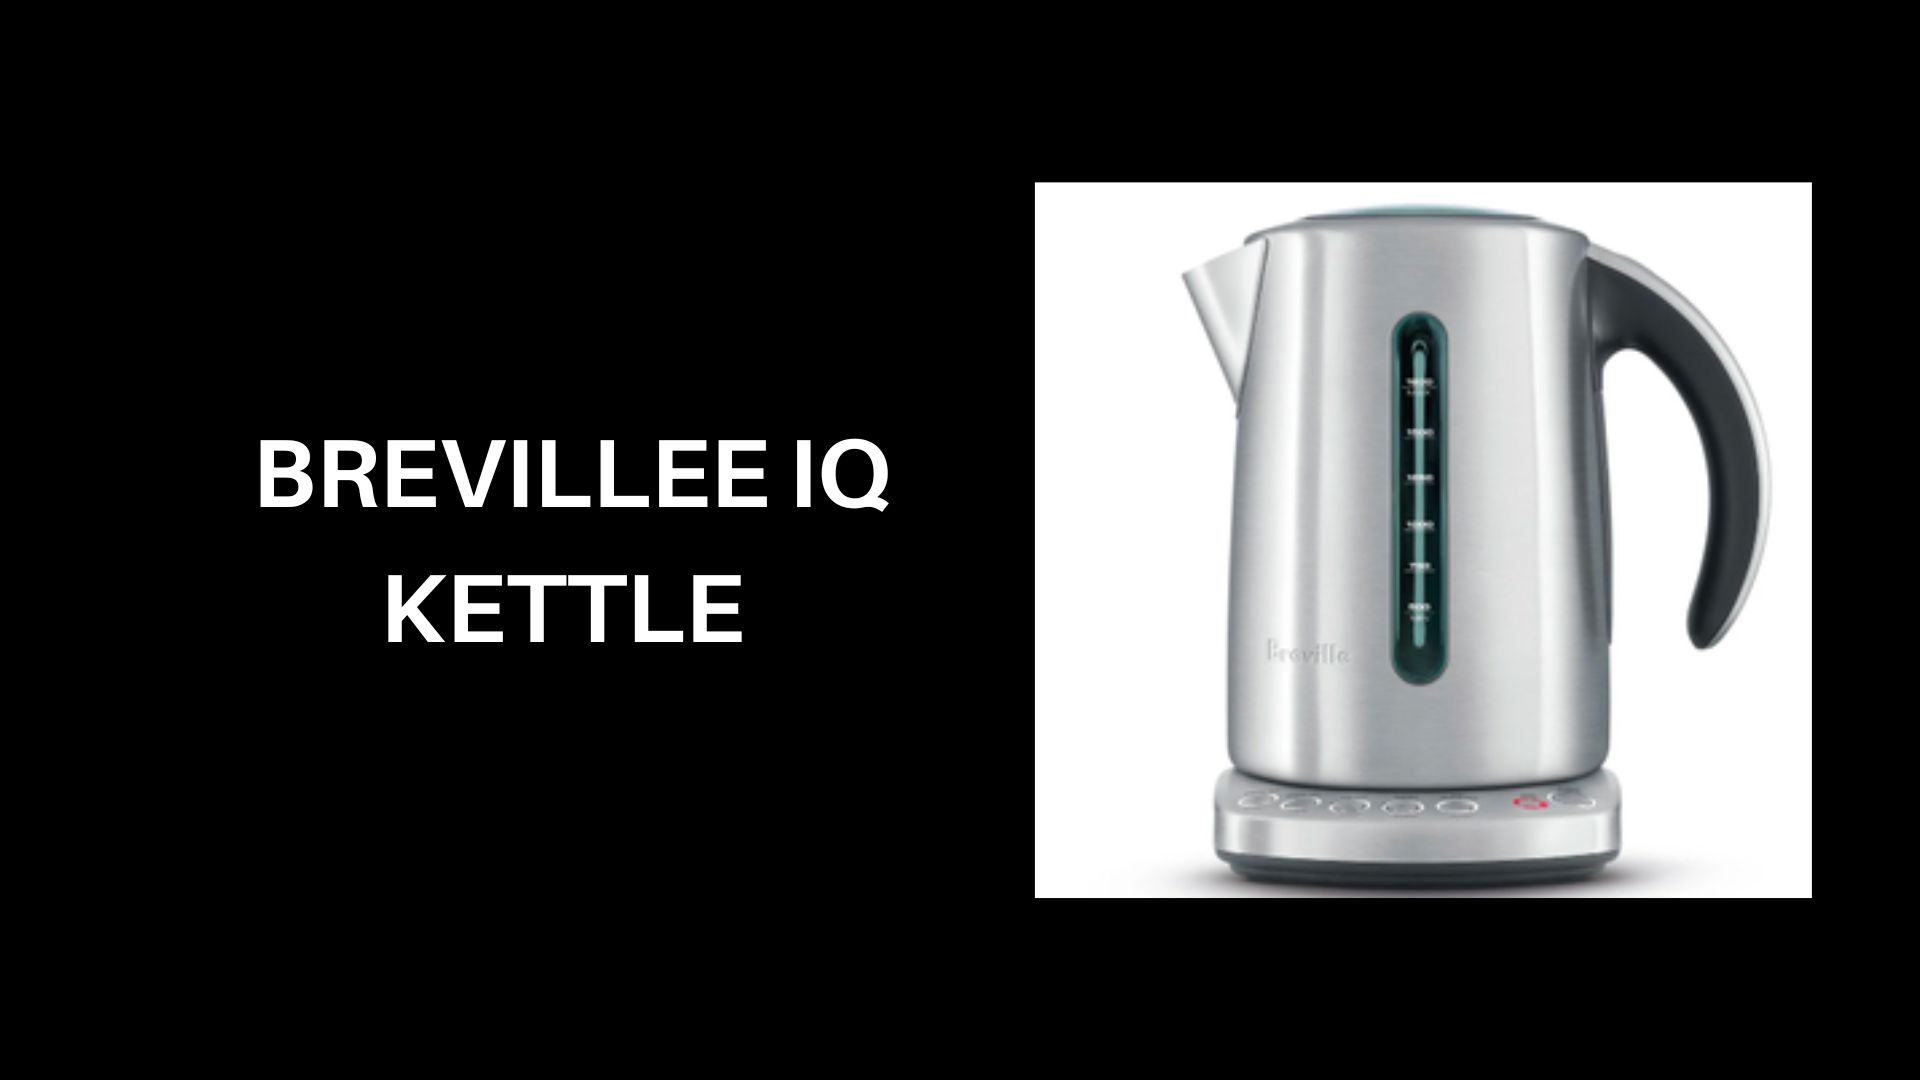
#2. Breville IQ Kettle (Sleeker but pricier)
(Source: nytimes.com)
- The cost of this kettle is around $140
- A feature includes a large 60.8-oz reservoir capacity, 1500W heating element, 5 preset brewing temperatures, keeps water warm for 20 minutes, and automatically turns off when the water reaches the boiling temperature.
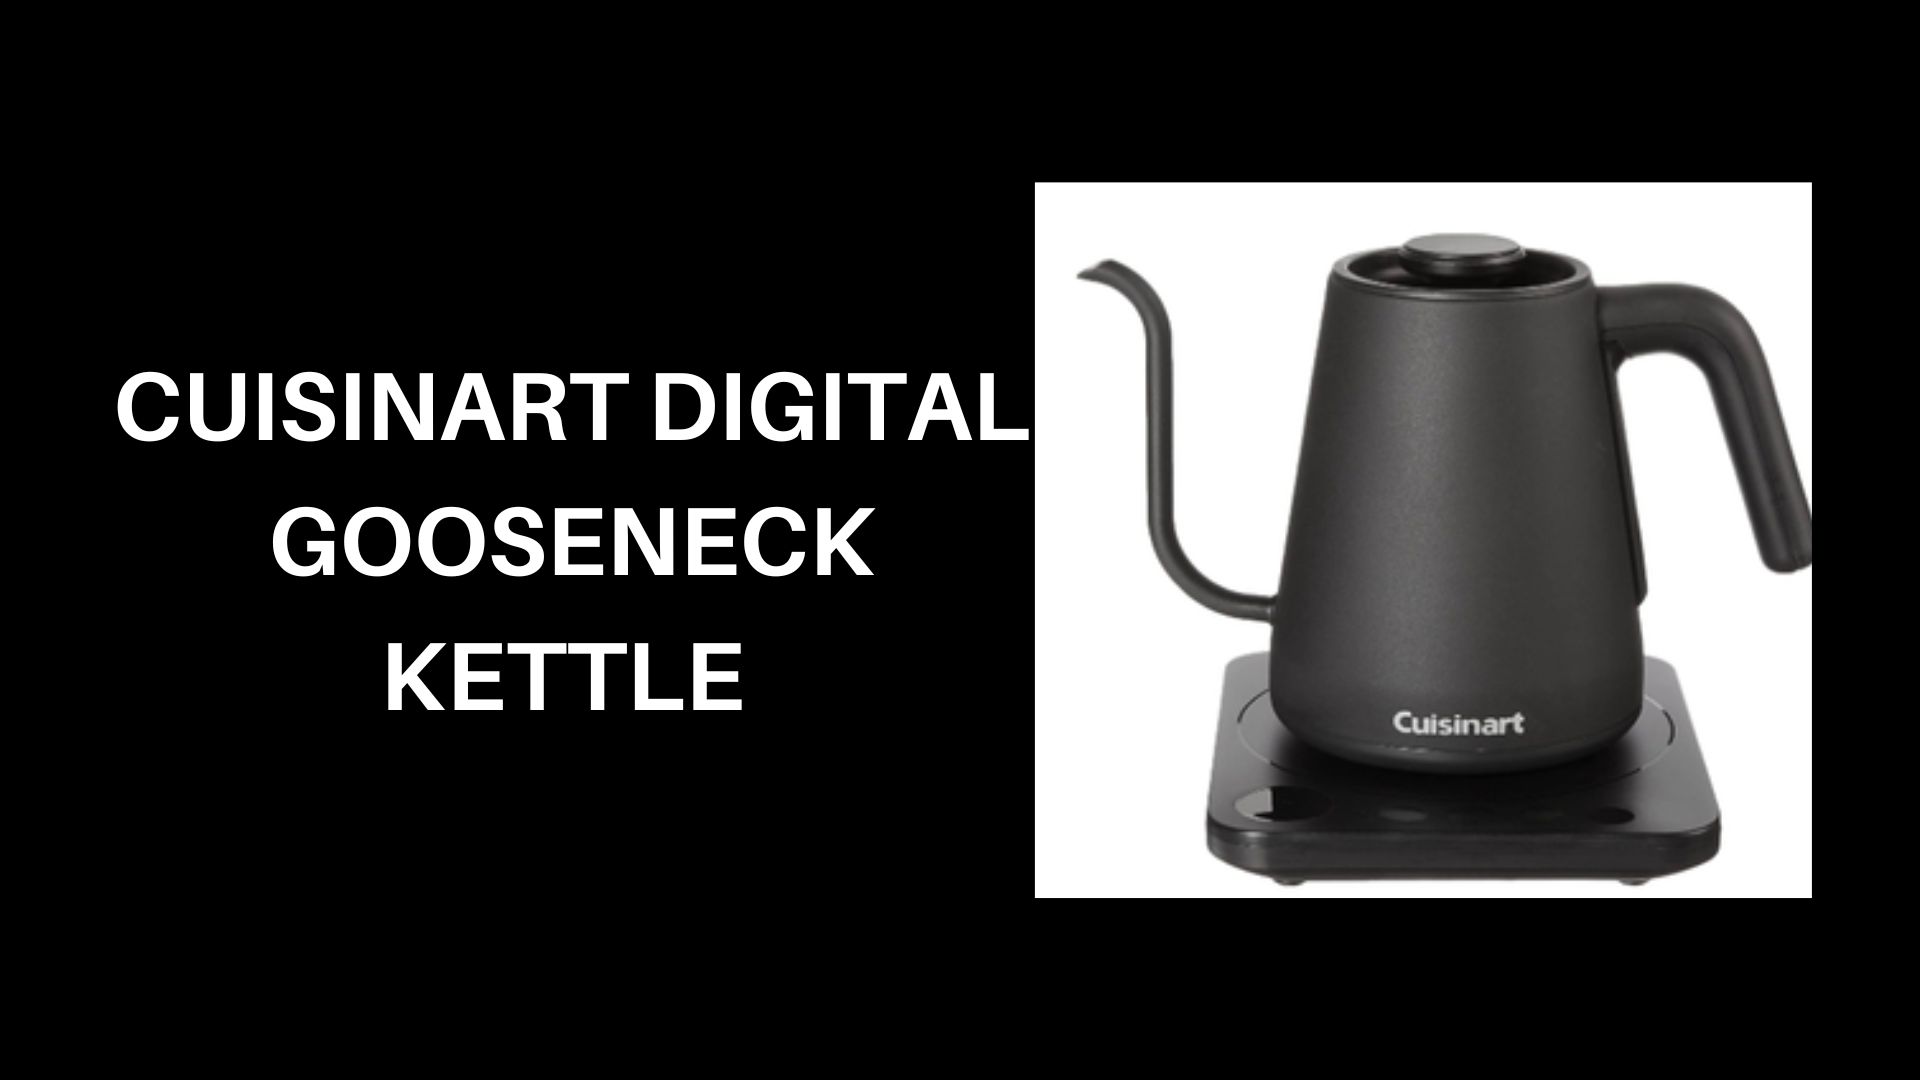
#3. Cuisinart Digital Gooseneck Kettle (best digital gooseneck kettle)
(Source: nytimes.com)
- The cost of this kettle is $100 at Amazon and $99 at Wayfair.
- Features enable boiling 1 liter of boiling water, one-touch control, keeping water warm for 30 minutes, stainless-steel kettle body, and a limited warranty of 3 years.
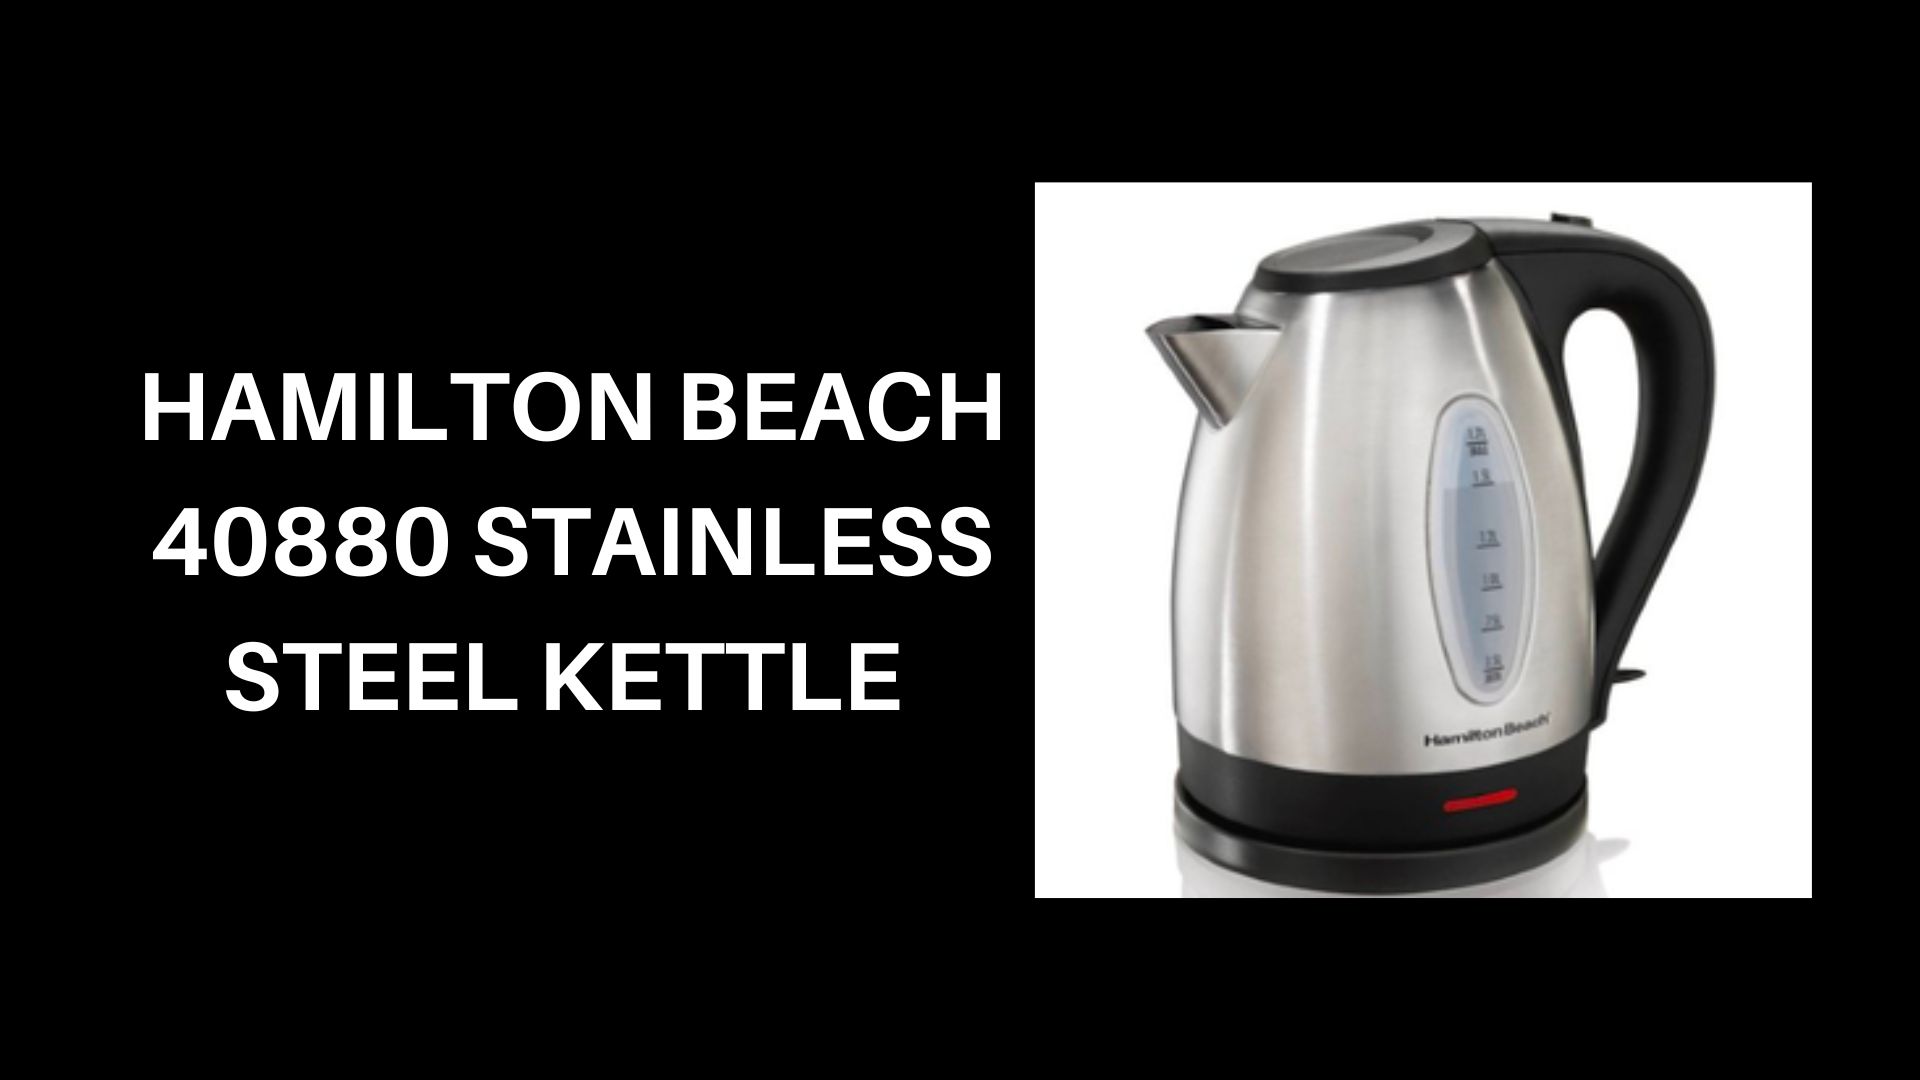
#4. Hamilton Beach 40880 Stainless Steel kettle (less expensive)
(Source: nytimes.com)
- This kettle costs around $37, which is easily available at Amazon.
- Features include a large 1.7 liter capacity for boiling water which is easily convenient, the technology used auto shut-off and boil-dry protection, and a concealed heating element facilitates easy clean up.
Conclusion
As of today, after completing the article on Electric Kettle Statistics it can be said that electric kettle are much more energy-efficient than microwaves and electric stovetops. The market shares of electric kettles are growing enormously around the world and by 2030 the market valuation is expected to reach $ 5.8 billion with a CAGR of 4.3% from 2023 to 2030. These kettles can be used for personal as well as commercial uses. In coming years with advanced technological developments, it has been predicted that the market is going to enhance more.
So, what are you waiting for? go and get one for yourself. This article includes several possible and effective statistics about the electric kettle industry that will help in understanding the topic better.